VIRTUAL SATELLITES = GLOBAL MEGA PROJECTS...
- Get link
- X
- Other Apps
01
Planet prepares to launch another line of imagery satellites to expand data-gathering operations
An artist's depiction of a Tanager satellite in orbit.
Planet
PARIS — Planet is adding another type of imagery satellite to its product line, the latest expansion of the company's data-gathering operations.
The company named the new satellites Tanager -- named after a bird family, like the existing lines of Dove and Pelican satellites that it manufactures. But unlike those satellites, which have cameras and sensors capturing images in the same range as the human eye, the Tanager satellites will capture "hyperspectral" imagery, which divides the light spectrum into hundreds of bands of light.
Planet co-founder and chief strategy officer Robbie Schingler, speaking to CNBC at the 2022 International Astronautical Congress, said the company will use the hyperspectral satellites initially to detect methane output, saying it's "the lowest hanging fruit" and has implications for business such as oil and gas, dairy farms and waste landfills.
Tanager satellites will collect 420 bands of spectrum, Schingler said, noting that detecting methane requires detecting just four bands.
"We decided to build a full-range imaging spectrometer," Schingler said, with uses cases beyond methane to markets like "defense intelligence, like seeing disturbed earth – things like burying something or digging a tunnel."
Planet aims to then tap customers in sectors like agriculture, mining, and intelligence with the Tanager line, with Schingler saying that "hyperspectral data from space is limited" as "the best hyperspectral sensors are either super classified, or they're in planes."
The company is building the Tanager satellites with the same spacecraft bus – which is the main body of a satellite – as its Pelican line, to leverage Planet's vertical approach to manufacturing. The first two Tanager demonstration satellites are set to launch in 2023.
New images reveal moment of DART asteroid impact captured by Italian satellite
Sign up for CNN’s Wonder Theory science newsletter. Explore the universe with news on fascinating discoveries, scientific advancements and more.
CNN —
History was made Monday night when NASA’s Double Asteroid Redirection Test spacecraft successfully slammed into the asteroid Dimorphos.
DART’s camera shared dramatic images of the asteroid’s surface before it crashed.
Now, new images captured by its companion, a cube satellite known as LICIACube, reveal what the impact looked like from another perspective.
The Light Italian CubeSat for Imaging of Asteroids, provided by the Italian Space Agency, is about the size of a briefcase. It deployed from the DART spacecraft on September 11 and traveled behind it to record the event from a safe distance of about 34 miles (55 kilometers).
Three minutes after impact, the CubeSat flew by Dimorphos – which orbits a larger asteroid, Didymos – to capture images and video.
The series of images showcases bright material releasing from the surface of Dimorphos after the collision. Didymos is in the foreground.
“Here are the pictures taken by @LICIACube of the world’s first planetary defense mission. This is exactly where the #NASA #DartMission ended. An incredible emotion, the beginning of new discoveries,” read a tweet from Argotec Space, an Italian company that developed the CubeSat for the Italian Space Agency.
The egg-shaped asteroid’s surface, covered in boulders, looked similar to Bennu and Ryugu, two other asteroids visited by spacecraft in recent years. Scientists suspect that Dimorphos is a rubble pile asteroid made of loosely bound rocks.
The mission team is eager to learn more about the impact crater left behind by DART, which they estimate to be about 33 to 65 feet (10 to 20 meters) in size. There may even be shattered pieces of the spacecraft in the crater.
The intentional collision, which took place about 6.8 million miles (11 million kilometers) away from Earth, was humanity’s first asteroid deflection attempt.
INTERACTIVE: One spacecraft’s journey to test Earth’s planetary defenses
Neither Dimorphos nor Didymospose a threat to Earth. But analysis of how much the DART spacecraft was able to alter Dimorphos’ motion could inform techniques to protect Earth should a space rock ever be heading for impact.
While it will take about two months for observations from ground-based telescopes to determine whether DART was successful in slightly shrinking Dimorphos’ orbit around Didymos, observatories, including the Virtual Telescope Project in Rome, are already sharing their perspective of the collision event.
Astronomers at the Les Makes observatory on the French island of La Reunion in the Indian Ocean also shared a sequence of images that show the asteroid brightening upon impact, as well as a cloud of material that released from its surface afterward. The cloud drifted eastward and dissipated slowly, according to the European Space Agency.
Les Makes is a collaborating station as part of the ESA’s Planetary Defense Office and Near-Earth Object Coordination Center.
A video of observations shared by the observatory condenses about 30 minutes worth of footage into just a few seconds.
“Something like this has never been done before, and we weren’t entirely sure what to expect. It was an emotional moment for us as the footage came in,” said Marco Micheli, astronomer at ESA’s Near-Earth Object Coordination Center, in a statement.
As astronomers around the world settle in to study their observations of the asteroid system after impact, the ESA’s Hera mission is gearing up for a future visit to Didymos and Dimorphos.
Hera will serve as a follow-up mission, launching in 2024.
“The results from DART will prepare us for Hera’s visit to the Didymos binary system to examine the aftermath of this impact a few years from now,” said Ian Carnelli, Hera Mission Manager, in a statement. “Hera will help us understand what happened to Dimorphos, the first celestial body to be measurably moved by humankind.”
SpaceX launches another 52 Starlink satellites, lands rocket at sea
SpaceX launched another 52 of its Starlink internet satellites to orbit Saturday evening (Sept. 24) and also aced a rocket landing at sea.
A Falcon 9 rocket topped with 52 Starlink spacecraft lifted off from Florida's Cape Canaveral Space Force Station Saturday at 7:32 p.m. EDT (2332 GMT).
Just under nine minutes later, the Falcon 9's first stage came back to Earth for a pinpoint touchdown on the SpaceX "droneship" A Shortfall of Gravitas, which was stationed in the Atlantic Ocean. It was the fourth liftoff and landing for this particular booster, according to a SpaceX mission description (opens in new tab).
Related: SpaceX's Starlink megaconstellation launches in photos

The Falcon 9's upper stage deployed the 52 Starlinks 15.5 minutes after liftoff as planned, SpaceX confirmed via Twitter (opens in new tab).
Saturday's launch continues the buildout of SpaceX's Starlink megaconstellation, which provides internet service for people around the world. The company has now lofted nearly 3,400 Starlink satellites and plans to launch thousands more.
Starting next year, SpaceX will begin launching Starlink Version 2 satellites, which will be much bigger and more capable than the current iteration. V2 spacecraft will be able to beam connectivity directly to smartphones, and will do so for T-Mobile customers via a project called "Coverage Above and Beyond," SpaceX founder and CEO Elon Musk announced last month.
SpaceX plans to launch Starlink V2 batches aboard its huge, next-generation Starship vehicle, which will also take cargo and people to the moon and Mars, if all goes according to plan. Starship's first orbital test flight is "highly likely" to occur in November, Musk said recently.
Saturday's launch was SpaceX's 43rd orbital mission of 2022, adding to the company's single-year liftoff record. SpaceX's previous high for launches in a year was 31, achieved in 2021.
Editor's note: This story was updated at 7:55 p.m. EDT on Sept. 24 with news of successful launch, rocket landing and satellite deploy.
Mike Wall is the author of "Out There (opens in new tab)" (Grand Central Publishing, 2018; illustrated by Karl Tate), a book about the search for alien life. Follow him on Twitter @michaeldwall (opens in new tab). Follow us on Twitter @Spacedotcom (opens in new tab) or on Facebook (opens in new tab).
NASA Says This Company's Giant 5G Satellites Could Cause "Catastrophic Collision"
This it the first time NASA has warned about a specific satellite mega-constellation. Crowded SkyFor the first time, NASA is commenting on a private company's application to launch a mega-constellation of satellites. And its message is clear: It could be disastrous.
AST & Science (AST) wants to launch 240 large satellites that would beam down 4G service and, if all goes to plan, eventually do the same with a 5G network, Ars Technica reports. Because the satellites will be so massive, NASA said in a statement that they would cause thousands of potential collisions every year — though AST says it's committed to working with NASA to solve the issue.
Horse In The HospitalOther mega-constellations like Starlink also pose collision risks, but it’s the massive size of these telecom satellites and AST's inexperience in building anything that large that has NASA particularly concerned, Ars reports.
Given that lack of experience, NASA suggested up to 10 percent of the satellites might fail, creating an "unacceptably high" risk of a "catastrophic collision."
Evasive ManeuversIn order to broadcast the 4G and eventually 5G signals, the satellites would come equipped with massive antennas up to 900 square meters in size. Given their planned proximity to other satellites, NASA says that's a disaster waiting to happen.
"For the completed constellation of 243 satellites, one can expect 1,500 mitigation actions per year and perhaps 15,000 planning activities," reads NASA's statement. "This would equate to four maneuvers and 40 active planning activities on any given day."
READ MORE: NASA objects to new mega-constellation, citing risk of “catastrophic collision” [Ars Technica]
More on satellite collisions: Three Percent of SpaceX's Starlink Satellites Died
Satellite imagery can provide an accurate view of US project deployment, enabling better business decisions
 Lium has deals with a couple of different satellite companies in order to provide images to clients. Image: Lium
The way that solar companies use and consume intelligence needs to change, with more accurate and reliable data on project deployment needed, especially in light of the recently passed Inflation Reduction Act (IRA).
That’s according to Joseph Triepke and Daniel Cruise, partners at energy market research company Lium, who believe that current deployment data based on anecdotal evidence, analyst research, news media and trade bodies are insufficient to fully capture what’s going on in the US market.
“If you just rely on that for market intelligence, sometimes those narratives that you see in the mainstream press actually diverge from what’s happening in the field,” Triepke tells PV Tech Premium. “And so I think the only way to really get an accurate read on what’s happening in the field unless you’re out there driving around all these sites is using some of the data that we’re putting together with satellites.”
Lium has deals with a couple of different satellite companies to track the progression of more than 650 solar projects in the US. “From there we have to digest and ask, what does that image mean? How has it changed from day-to-day or month-to-month? And then fit it into the solar space,” says Cruise.
And while just 150 of those projects might currently be being built, there is the potential for the remaining 550 to start any day, which would give solar stakeholders critical deployment information, rather than relying on anecdotal evidence from analysts, reporters or trade bodies, the pair said.
At present, Lium has “been able to pull up enough imagery and enough data to go back a full two years at looking how the space has progressed,” says Cruise, adding that while the company could go back further, the last two years have been particularly relevant US in the solar industry given recent import restrictions and their impact on the country’s solar deployment levels.
More recently, Lium’s satellite imagery has taken on even greater significance, the pair explain. “I think the IRA only serves to accelerate that sense of urgency,” says Triepke, with Lium’s recent SolarSAT report stating how the IRA will “drastically change the solar landscape in the US”.
“Coinciding with this revolutionary government action, we are launching a new intelligence product to track in real-time the development of every large scale solar project through satellite imagery,” said the report.
This would help demonstrate to Lium’s clients, which are currently mainly investors, how busy the US market is, says Cruise. “Is this stock that I’m looking at, or the private equity investment I’m looking at, going to be providing equipment into a market that’s busy or not busy?,” asks Cruise, “So, you can get some big picture trends.”
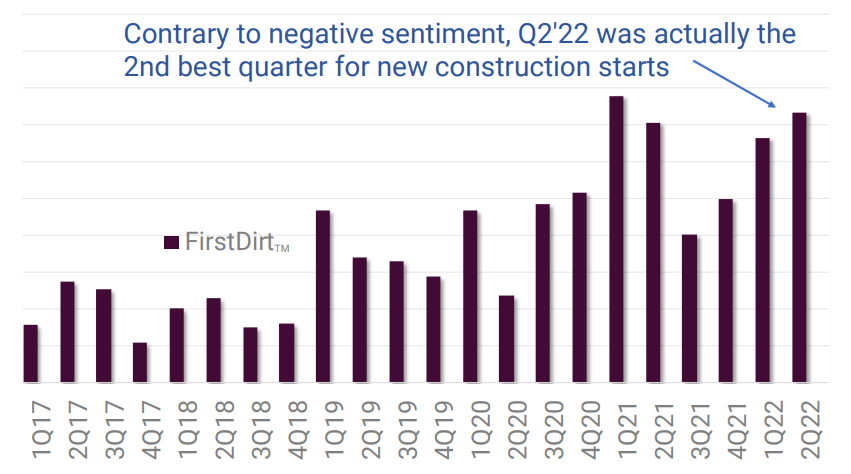 Lium has built specific capabilities to track exactly when each project begins constructionor ‘turns dirt’, dubbed firstDIRT. Source: Lium
But the satellites also allow for a more granular analysis too that can provide businesses the opportunity to get ahead of their competitors. “If I see three or four big solar projects that turned dirt in April or May,” Cruise says, “I know the tracker companies that will be providing the trackers for those projects in July, August and September. And so, essentially, I can tie directly to revenues based on what I’m seeing in the satellite imagery.”
Likewise, companies would also been able to use Lium’s imagery to see which developers are breaking ground on what project, information that often is not made public. This would allow business to pitch their services to developers for specific parts of the project ahead of any public announcement.
“You can then start to market your equipment and your services to this developer and, if you’re a staffing company, you can get workers out where the staffing needs to be done on a real-time basis,” Cruise explains, with Triepke adding that it allows users to separate reality from expectations.
“A lot of times the consensus narrative does not reflect reality in these markets,” says Triepke. “You’ll [often] have a bunch of hubbub over one thing, maybe it’s tariffs or something, there’s a lot of fear mongering and everyone’s worried about it, but no one really knows what that’s doing in the field.
“I think this data gives investors higher conviction in their trades because they can essentially see the whole market going this way, but the data on the ground tells me that my thesis is accurate.”
This mismatch was highlighted in Lium’s solarSAT report which argued that in April 2022, “misleading surveys related to tariffs exaggerated fear and misallocated investor capital”, which Lium said would not have been the case with “alternatively tracking data with satellite imagery”.
Referencing the investigation into alleged circumvention of antidumping and countervailing duties (AD/CVD) by solar manufacturers in Southeast Asia, Cruise says the industry was relying on anecdotal evidence from importers regarding what was getting seized rather than looking at satellite data that could show project progress before module delivery.
“And the reason that’s important is because if you’re investor, you’re not just concerned about this one issue here in a few months. You want to see if it is impacting the broader industry and if it means that developers won’t develop two years from now. Or is it more near current term concern that they won’t be able to get panels next month?” he asks.
Lium used its satellite imagery from the period to inform its investors about which companies were still constructing projects, with or without modules, and advised them to buy shares in those that were. “When the big draconian estimates and the forecast were being placed out there, it was an excellent time to actually invest in the solar space,” says Cruise.
Moreover, satellite imagery also allows Lium users to see which projects have received their modules, enabling the user to get in touch with the developer and ask detailed questions about the import package submitted, future business partnerships and more.
Cruise gives the example of NextEra Energy, which said its operations were being halted by the AD/CVD investigation but had in fact started more projects between May and June than it had in the past two years. “And so you weren’t able to see that unless you look through what they were saying and into the actual activity that they were doing on the ground.”
Given the value of such a service, the pair believe it is inevitable that their satellite approach will be replicated but say their experience in other fields, such as oil and gas, as well as their technical expertise in certain areas will make it difficult to copy. “To us it makes so much sense, it’s got to be copied by others out there,” adds Cruise, although for now at least he believes they are alone in the field.
Lium will be presenting at Solar Media’s Solar & Storage Finance USA event on 4-5 October 2022 in New York. A registration link to the event can be found here.
Global Virtual Desktop Infrastructure Market by top manufacturers, type and application, with sales market share and growth rate Forecasts till 2025
Virtual Desktop Infrastructure Market Global 2022 presents detailed competitive analysis including the market Share, Size, Future scope. This study categorizes the global Health and Safety Products breakdown data by manufacturers, region, type and applications, also analyzes the market drivers, opportunities and challenges. Virtual Desktop Infrastructure Market Report will add the analysis of the impact of COVID-19 on this industry.
Global “Virtual Desktop Infrastructure Market” (2022-2025) research report provides key analysis on the market status of Virtual Desktop Infrastructure manufacturers with the best facts and figures, definitions, SWOT analysis, expert opinions and the latest developments around the world. The all-inclusive market research report also offers Porter’s Five Forces Analysis and profiles some of the leading players of the global Virtual Desktop Infrastructure Market. It sheds light on changing market dynamics and discusses about different growth drivers, market challenges and restraints, and trends and opportunities in detail. Interested parties are provided with market recommendations and business advice to ensure success in the global Virtual Desktop Infrastructure market.
Get a sample PDF of the report at –https://www.researchreportsworld.com/enquiry/request-sample/16662620
The global Virtual Desktop Infrastructure market is anticipated to rise at a considerable rate during the forecast period, between 2021 and 2025. In 2022, the market was growing at a steady rate and with the rising adoption of strategies by key players, the market is expected to rise over the projected horizon.
The report also tracks the latest market dynamics, such as driving factors, restraining factors, and industry news like mergers, acquisitions, and investments. Global Virtual Desktop Infrastructure Market Size (value and volume), market share, growth rate by types, applications, and combines both qualitative and quantitative methods to make micro and macro forecasts in different regions or countries.
“Final Report will add the analysis of the impact of COVID-19 on this industry.”
To Understand How COVID-19 Impact is Covered in This Report. Get Sample copy of the report at –https://www.researchreportsworld.com/enquiry/request-covid19/16662620
List Of TOP KEY PLAYERS in Virtual Desktop Infrastructure Market Report Covered in Chapter 5 –
The report also focuses on global major leading industry players of Global Virtual Desktop Infrastructure Market Share providing information such as company profiles, product picture and specification, capacity, production, price, cost, revenue and contact information. Upstream raw materials and equipment and downstream demand analysis is also carried out. With tables and figures helping analyse worldwide Global Virtual Desktop Infrastructure Market Forecast this research provides key statistics on the state of the industry and is a valuable source of guidance and direction for companies and individuals interested in the market.
Get a Sample PDF of the Virtual Desktop Infrastructure Market Report 2020
The Global Virtual Desktop Infrastructure Market Trends,development and marketing channels are analysed. Finally, the feasibility of new investment projects is assessed and overall research conclusions offered.
In Chapter 6, on the basis of types, the Virtual Desktop Infrastructure Market from 2015 to 2025 is primarily split into:
In Chapter 7, on the basis of applications, the Virtual Desktop Infrastructure Market from 2015 to 2025 covers:
Enquire before purchasing this report –https://www.researchreportsworld.com/enquiry/pre-order-enquiry/16662620
Some of the key questions answered in this report:
Major regions covered in the report:
Purchase this report (Price 3500 USD for single user license) –https://www.researchreportsworld.com/purchase/16662620
Major Points from Table of Contents:
1 Market Overview1.1 Product Definition and Market Characteristics1.2 Global Virtual Desktop Infrastructure Market Size1.3 Market Segmentation1.4 Global Macroeconomic Analysis1.5 SWOT Analysis
2. Market Dynamics2.1 Market Drivers2.2 Market Constraints and Challenges2.3 Emerging Market Trends2.4 Impact of COVID-192.4.1 Short-term Impact2.4.2 Long-term Impact
3 Associated Industry Assessment3.1 Supply Chain Analysis3.2 Industry Active Participants3.2.1 Suppliers of Raw Materials3.2.2 Key Distributors/Retailers3.3 Alternative Analysis3.4 The Impact of Covid-19 From the Perspective of Industry Chain
4 Market Competitive Landscape4.1 Industry Leading Players4.2 Industry News4.2.1 Key Product Launch News4.2.2 MandA and Expansion Plans
5 Analysis of Leading Companies5.1 Hewlett-Packard (HP)5.1.1 Hewlett-Packard (HP) Company Profile5.1.2 Hewlett-Packard (HP) Business Overview5.1.3 Hewlett-Packard (HP) Virtual Desktop Infrastructure Sales, Revenue, Average Selling Price and Gross Margin (2015-2021)5.1.4 Hewlett-Packard (HP) Virtual Desktop Infrastructure Products Introduction5.2 Cisco Systems5.2.1 Cisco Systems Company Profile5.2.2 Cisco Systems Business Overview5.2.3 Cisco Systems Virtual Desktop Infrastructure Sales, Revenue, Average Selling Price and Gross Margin (2015-2021)5.2.4 Cisco Systems Virtual Desktop Infrastructure Products Introduction5.3 Citrix5.3.1 Citrix Company Profile5.3.2 Citrix Business Overview5.3.3 Citrix Virtual Desktop Infrastructure Sales, Revenue, Average Selling Price and Gross Margin (2015-2021)5.3.4 Citrix Virtual Desktop Infrastructure Products Introduction5.4 VMware5.4.1 VMware Company Profile5.4.2 VMware Business Overview5.4.3 VMware Virtual Desktop Infrastructure Sales, Revenue, Average Selling Price and Gross Margin (2015-2021)5.4.4 VMware Virtual Desktop Infrastructure Products Introduction5.5 Secure Online Desktop5.5.1 Secure Online Desktop Company Profile5.5.2 Secure Online Desktop Business Overview5.5.3 Secure Online Desktop Virtual Desktop Infrastructure Sales, Revenue, Average Selling Price and Gross Margin (2015-2021)5.5.4 Secure Online Desktop Virtual Desktop Infrastructure Products Introduction5.6 Tucloudred Hat5.6.1 Tucloudred Hat Company Profile5.6.2 Tucloudred Hat Business Overview5.6.3 Tucloudred Hat Virtual Desktop Infrastructure Sales, Revenue, Average Selling Price and Gross Margin (2015-2021)5.6.4 Tucloudred Hat Virtual Desktop Infrastructure Products Introduction5.7 Huawei Enterprise5.7.1 Huawei Enterprise Company Profile5.7.2 Huawei Enterprise Business Overview5.7.3 Huawei Enterprise Virtual Desktop Infrastructure Sales, Revenue, Average Selling Price and Gross Margin (2015-2021)5.7.4 Huawei Enterprise Virtual Desktop Infrastructure Products Introduction5.8 Virtual Bridge5.8.1 Virtual Bridge Company Profile5.8.2 Virtual Bridge Business Overview5.8.3 Virtual Bridge Virtual Desktop Infrastructure Sales, Revenue, Average Selling Price and Gross Margin (2015-2021)5.8.4 Virtual Bridge Virtual Desktop Infrastructure Products Introduction5.9 NComputing5.9.1 NComputing Company Profile5.9.2 NComputing Business Overview5.9.3 NComputing Virtual Desktop Infrastructure Sales, Revenue, Average Selling Price and Gross Margin (2015-2021)5.9.4 NComputing Virtual Desktop Infrastructure Products Introduction5.10 Tech Data Corporation5.10.1 Tech Data Corporation Company Profile5.10.2 Tech Data Corporation Business Overview5.10.3 Tech Data Corporation Virtual Desktop Infrastructure Sales, Revenue, Average Selling Price and Gross Margin (2015-2021)5.10.4 Tech Data Corporation Virtual Desktop Infrastructure Products Introduction5.11 Dell5.11.1 Dell Company Profile5.11.2 Dell Business Overview5.11.3 Dell Virtual Desktop Infrastructure Sales, Revenue, Average Selling Price and Gross Margin (2015-2021)5.11.4 Dell Virtual Desktop Infrastructure Products Introduction5.12 Rackspace5.12.1 Rackspace Company Profile5.12.2 Rackspace Business Overview5.12.3 Rackspace Virtual Desktop Infrastructure Sales, Revenue, Average Selling Price and Gross Margin (2015-2021)5.12.4 Rackspace Virtual Desktop Infrastructure Products Introduction5.13 Amazon5.13.1 Amazon Company Profile5.13.2 Amazon Business Overview5.13.3 Amazon Virtual Desktop Infrastructure Sales, Revenue, Average Selling Price and Gross Margin (2015-2021)5.13.4 Amazon Virtual Desktop Infrastructure Products Introduction5.14 Fujitsu Global5.14.1 Fujitsu Global Company Profile5.14.2 Fujitsu Global Business Overview5.14.3 Fujitsu Global Virtual Desktop Infrastructure Sales, Revenue, Average Selling Price and Gross Margin (2015-2021)5.14.4 Fujitsu Global Virtual Desktop Infrastructure Products Introduction5.15 Netelligent5.15.1 Netelligent Company Profile5.15.2 Netelligent Business Overview5.15.3 Netelligent Virtual Desktop Infrastructure Sales, Revenue, Average Selling Price and Gross Margin (2015-2021)5.15.4 Netelligent Virtual Desktop Infrastructure Products Introduction5.16 MokaFive5.16.1 MokaFive Company Profile5.16.2 MokaFive Business Overview5.16.3 MokaFive Virtual Desktop Infrastructure Sales, Revenue, Average Selling Price and Gross Margin (2015-2021)5.16.4 MokaFive Virtual Desktop Infrastructure Products Introduction5.17 CITIC5.17.1 CITIC Company Profile5.17.2 CITIC Business Overview5.17.3 CITIC Virtual Desktop Infrastructure Sales, Revenue, Average Selling Price and Gross Margin (2015-2021)5.17.4 CITIC Virtual Desktop Infrastructure Products Introduction5.18 IBM5.18.1 IBM Company Profile5.18.2 IBM Business Overview5.18.3 IBM Virtual Desktop Infrastructure Sales, Revenue, Average Selling Price and Gross Margin (2015-2021)5.18.4 IBM Virtual Desktop Infrastructure Products Introduction5.19 Microsoft5.19.1 Microsoft Company Profile5.19.2 Microsoft Business Overview5.19.3 Microsoft Virtual Desktop Infrastructure Sales, Revenue, Average Selling Price and Gross Margin (2015-2021)5.19.4 Microsoft Virtual Desktop Infrastructure Products Introduction5.20 NTT Europe Ltd5.20.1 NTT Europe Ltd Company Profile5.20.2 NTT Europe Ltd Business Overview5.20.3 NTT Europe Ltd Virtual Desktop Infrastructure Sales, Revenue, Average Selling Price and Gross Margin (2015-2021)5.20.4 NTT Europe Ltd Virtual Desktop Infrastructure Products Introduction5.21 Moka55.21.1 Moka5 Company Profile5.21.2 Moka5 Business Overview5.21.3 Moka5 Virtual Desktop Infrastructure Sales, Revenue, Average Selling Price and Gross Margin (2015-2021)5.21.4 Moka5 Virtual Desktop Infrastructure Products Introduction
6 Market Analysis and Forecast, By Product Types6.1 Global Virtual Desktop Infrastructure Sales, Revenue and Market Share by Types (2015-2021)6.1.1 Global Virtual Desktop Infrastructure Sales and Market Share by Types (2015-2021)6.1.2 Global Virtual Desktop Infrastructure Revenue and Market Share by Types (2015-2021)6.1.3 Global Virtual Desktop Infrastructure Price by Types (2015-2021)6.2 Global Virtual Desktop Infrastructure Market Forecast by Types (2021-2025)6.2.1 Global Virtual Desktop Infrastructure Market Forecast Sales and Market Share by Types (2021-2025)6.2.2 Global Virtual Desktop Infrastructure Market Forecast Revenue and Market Share by Types (2021-2025)6.3 Global Virtual Desktop Infrastructure Sales, Price and Growth Rate by Types (2015-2021)6.3.1 Global Virtual Desktop Infrastructure Sales, Price and Growth Rate of On-premise6.3.2 Global Virtual Desktop Infrastructure Sales, Price and Growth Rate of Cloud Based6.4 Global Virtual Desktop Infrastructure Market Revenue and Sales Forecast, by Types (2021-2025)6.4.1 On-premise Market Revenue and Sales Forecast (2021-2025)6.4.2 Cloud Based Market Revenue and Sales Forecast (2021-2025)
7 Market Analysis and Forecast, By Applications7.1 Global Virtual Desktop Infrastructure Sales, Revenue and Market Share by Applications (2015-2021)7.1.1 Global Virtual Desktop Infrastructure Sales and Market Share by Applications (2015-2021)7.1.2 Global Virtual Desktop Infrastructure Revenue and Market Share by Applications (2015-2021)7.2 Global Virtual Desktop Infrastructure Market Forecast by Applications (2021-2025)7.2.1 Global Virtual Desktop Infrastructure Market Forecast Sales and Market Share by Applications (2021-2025)7.2.2 Global Virtual Desktop Infrastructure Market Forecast Revenue and Market Share by Applications (2021-2025)7.3 Global Revenue, Sales and Growth Rate by Applications (2015-2021)7.3.1 Global Virtual Desktop Infrastructure Revenue, Sales and Growth Rate of Virtualisation (2015-2021)7.3.2 Global Virtual Desktop Infrastructure Revenue, Sales and Growth Rate of Grid Computing (2015-2021)7.3.3 Global Virtual Desktop Infrastructure Revenue, Sales and Growth Rate of Enterprise Cloud (2015-2021)7.4 Global Virtual Desktop Infrastructure Market Revenue and Sales Forecast, by Applications (2021-2025)7.4.1 Virtualisation Market Revenue and Sales Forecast (2021-2025)7.4.2 Grid Computing Market Revenue and Sales Forecast (2021-2025)7.4.3 Enterprise Cloud Market Revenue and Sales Forecast (2021-2025)
8 Market Analysis and Forecast, By Regions8.1 Global Virtual Desktop Infrastructure Sales by Regions (2015-2021)8.2 Global Virtual Desktop Infrastructure Market Revenue by Regions (2015-2021)8.3 Global Virtual Desktop Infrastructure Market Forecast by Regions (2021-2025)
9 North America Virtual Desktop Infrastructure Market Analysis9.1 Market Overview and Prospect Analysis9.2 North America Virtual Desktop Infrastructure Market Sales and Growth Rate (2015-2021)9.3 North America Virtual Desktop Infrastructure Market Revenue and Growth Rate (2015-2021)9.4 North America Virtual Desktop Infrastructure Market Forecast9.5 The Influence of COVID-19 on North America Market9.6 North America Virtual Desktop Infrastructure Market Analysis by Country9.6.1 U.S. Virtual Desktop Infrastructure Sales and Growth Rate9.6.2 Canada Virtual Desktop Infrastructure Sales and Growth Rate9.6.3 Mexico Virtual Desktop Infrastructure Sales and Growth Rate
10 Europe Virtual Desktop Infrastructure Market Analysis10.1 Market Overview and Prospect Analysis10.2 Europe Virtual Desktop Infrastructure Market Sales and Growth Rate (2015-2021)10.3 Europe Virtual Desktop Infrastructure Market Revenue and Growth Rate (2015-2021)10.4 Europe Virtual Desktop Infrastructure Market Forecast10.5 The Influence of COVID-19 on Europe Market10.6 Europe Virtual Desktop Infrastructure Market Analysis by Country10.6.1 Germany Virtual Desktop Infrastructure Sales and Growth Rate10.6.2 United Kingdom Virtual Desktop Infrastructure Sales and Growth Rate10.6.3 France Virtual Desktop Infrastructure Sales and Growth Rate10.6.4 Italy Virtual Desktop Infrastructure Sales and Growth Rate10.6.5 Spain Virtual Desktop Infrastructure Sales and Growth Rate10.6.6 Russia Virtual Desktop Infrastructure Sales and Growth Rate
11 Asia-Pacific Virtual Desktop Infrastructure Market Analysis11.1 Market Overview and Prospect Analysis11.2 Asia-Pacific Virtual Desktop Infrastructure Market Sales and Growth Rate (2015-2021)11.3 Asia-Pacific Virtual Desktop Infrastructure Market Revenue and Growth Rate (2015-2021)11.4 Asia-Pacific Virtual Desktop Infrastructure Market Forecast11.5 The Influence of COVID-19 on Asia Pacific Market11.6 Asia-Pacific Virtual Desktop Infrastructure Market Analysis by Country11.6.1 China Virtual Desktop Infrastructure Sales and Growth Rate11.6.2 Japan Virtual Desktop Infrastructure Sales and Growth Rate11.6.3 South Korea Virtual Desktop Infrastructure Sales and Growth Rate11.6.4 Australia Virtual Desktop Infrastructure Sales and Growth Rate11.6.5 India Virtual Desktop Infrastructure Sales and Growth Rate
12 South America Virtual Desktop Infrastructure Market Analysis12.1 Market Overview and Prospect Analysis12.2 South America Virtual Desktop Infrastructure Market Sales and Growth Rate (2015-2021)12.3 South America Virtual Desktop Infrastructure Market Revenue and Growth Rate (2015-2021)12.4 South America Virtual Desktop Infrastructure Market Forecast12.5 The Influence of COVID-19 on South America Market12.6 South America Virtual Desktop Infrastructure Market Analysis by Country12.6.1 Brazil Virtual Desktop Infrastructure Sales and Growth Rate12.6.2 Argentina Virtual Desktop Infrastructure Sales and Growth Rate12.6.3 Columbia Virtual Desktop Infrastructure Sales and Growth Rate
13 Middle East and Africa Virtual Desktop Infrastructure Market Analysis13.1 Market Overview and Prospect Analysis13.2 Middle East and Africa Virtual Desktop Infrastructure Market Sales and Growth Rate (2015-2021)13.3 Middle East and Africa Virtual Desktop Infrastructure Market Revenue and Growth Rate (2015-2021)13.4 Middle East and Africa Virtual Desktop Infrastructure Market Forecast13.5 The Influence of COVID-19 on Middle East and Africa Market13.6 Middle East and Africa Virtual Desktop Infrastructure Market Analysis by Country13.6.1 UAE Virtual Desktop Infrastructure Sales and Growth Rate13.6.2 Egypt Virtual Desktop Infrastructure Sales and Growth Rate13.6.3 South Africa Virtual Desktop Infrastructure Sales and Growth Rate
14 Conclusions and Recommendations14.1 Key Market Findings and Prospects14.2 Advice for Investors
15 Appendix15.1 Methodology15.2 Research Data Source
…………Continued
Browse complete table of contents at –https://www.researchreportsworld.com/TOC/16662620#TOC
About Us:
Research Reports Worldis the credible source for gaining the market reports that will provide you with the lead your business needs. At Research Reports World, our objective is providing a platform for many top-notch market research firms worldwide to publish their research reports, as well as helping the decision makers in finding most suitable market research solutions under one roof. Our aim is to provide the best solution that matches the exact customer requirements. This drives us to provide you with custom or syndicated research reports.
Contact Us:
Research Reports World
Email:[email protected]
Phone:
US – (+1) 424 253 0807
UK – (+44) 203 239 8187
Our Other Reports:
Ink Solvents Market 2022 Worldwide Industry Size, Share, Gross Margin, Trend, Future Demand, Analysis by Top Leading Player and Forecast till 2028
Cotton Blended Fabric Market Size, Growth Share, Future Trends, 2022 Top Key Players Review, Demand and Global Analysis by Forecast
Leather Trousers Market 2022 Global Industry Share, Size, Global Industry Analysis, Key Growth Drivers Trends, Segments, Emerging Technologies, Opportunity and Forecast 2022 to 2028 | Top Countries Data
Grill Grates Market Size 2022 By Global Business Trends, Share, Future Demand, Progress Insight, Statistics, Key Regions, Prominent Players and Forecast to 2028
Gynecology Medical Laser Market 2022 Global Future Growth, Leading Players, Industry Updates, Business Prospects, Forthcoming Developments and Future Investments by Forecast to 2028
Global Synthetic Industrial Adhesive Market Size in 2022 | Size, Recent Trends, Demand and Share Estimation by 2028 with Top Players | Top Countries Data
Press Release Distributed by The Express Wire
To view the original version on The Express Wire visit Global Virtual Desktop Infrastructure Market by top manufacturers, type and application, with sales market share and growth rate Forecasts till 2025

Comments
Post a Comment
If you have any doubt, please let me know....